Experts predicted that a powerful magnitude 9.0 earthquake may rip through the Pacific Coast, killings thousands of lives and causing tsunami waves up to 20 meters high. From their prediction, the hypothetical magnitude-9.0 earthquake may happen along the Cascadia Subduction Zone, which is a fault line runs from northern Vancouver Island to Northern California. It will cause a 15 to 20 meters tsunami, and areas along the Pacific Coast will be hit the hardest.
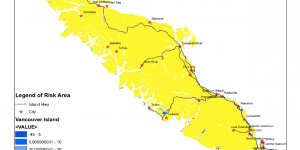
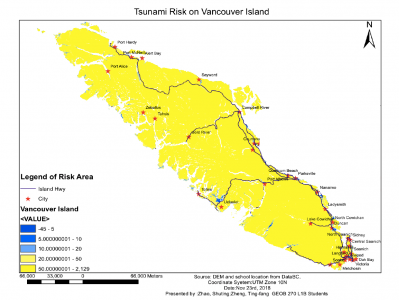
Geographic analysis for the potential risk area becomes most important to evacuate people, in order to solving the problem that will occur while tsunami hits the island, a series analysis on risk area has been done. The risk of 5m, 10m and 20m tsunami has been analyzed separately, and the 50m damage zone has also been examined.The dataset was gathered from DataBC and G: Drive from GEOB 270 course lab in Dec 4th, 2018. In this project, a series of maps was produced to show our general analysis and a analytical report was provided to summarize the result.
- All layer from different sources were reprojected to UTM Zone 10N_NAD83 to represent this area.
- DEM layers (92c13e, 92c13w, 92c14w, 92e01e, 92f03w, 92f04e, 92f04w) were merged to one new layer.
- The DEM layer was clipped to the shape of Vancouver Island to provide a clean look of the relevant subject.
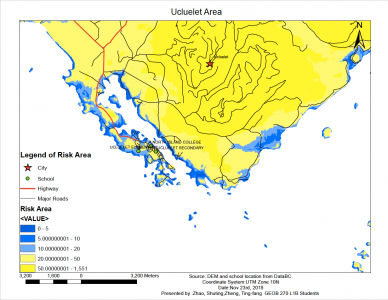
- The DEM layer of this area was reclassified using manual break to group the damage area by different levels of tsunami.
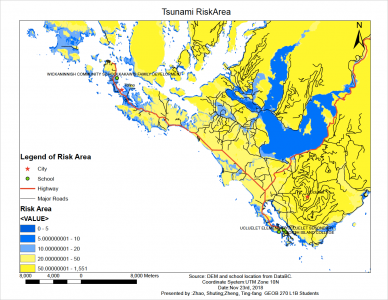
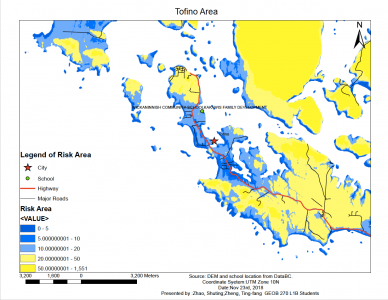
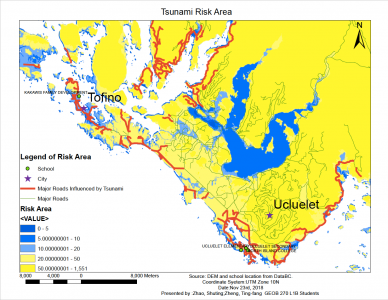
- Then the shoreline of this area was buffered with 1 km and intersected with roads layer to describe the drowning section.
From the analysis, we determined the damage by tsunami in Tofino is worse than that in Ucluelet. Ucluelet has more schools influenced by tsunami but Tofino has higher chance fall within flooding due to roads drowned. In Tofino, total of 12.61% of the area will be damaged by the tsunami. whereas in Ucluelet, otal of 7.94% of the area will be damaged by the tsunami. About 276 km of roads (about 30.23%) in this area will be drowned by tsunami flood.
The project took 3 weeks to complete, and each member in the team got equal share of work.
- Full report.Final Project Report_Zhao&Zheng
Full image.Final Project Figure 1_Zhao&Zheng Final Project Figure 2_Zhao&Zheng Final Project Figure 3_Zhao&Zheng Final Project Figure 4_Zhao&Zheng Final Project Figure 6_Zhao&Zheng
--All layer from different sources were reprojected to UTM Zone 10N_NAD83 to represent this area.
--DEM layers (92c13e, 92c13w, 92c14w, 92e01e, 92f03w, 92f04e, 92f04w) were merged to one new layer.
--The DEM layer was clipped to the shape of Vancouver Island to provide a clean look of the relevant subject.
--The DEM layer of this area was reclassified using manual break to group the damage area by different levels of tsunami.
--Then the shoreline of this area was buffered with 1 km and intersected with roads layer to describe the drowning section.