CTs and DAs are small geographical areas useful for Census analyses. However, CTs are used in
only in large urban areas, and DAs are smallest province-wide areas across the country. CTs has
its advantages of being general and distinguishable (especially, viewing Canada as a whole
country), but it cannot represent the detail of an area. When using DAs in a larger area, people
may get confused because of the complicated levels of data, but it is an excellent representation
of small area with detail information.
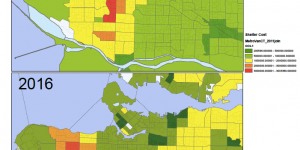
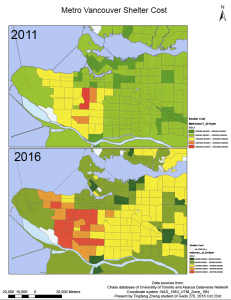
In this lab, the housing value at Vancouver increased rapidly during 2011 to 2016, as the red area expanded fast.
- Acquire Spatial and Tabular Census Data from University of Toronto census data site, then join the tabular data to spatial layers in order to visualizing housing data.
- A geodatabase was create to store and organize data.
- All layer from different sources were reprojected to UTM Zone 10N_NAD83 to represent this area.
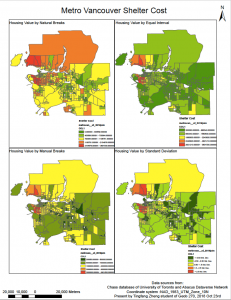
- The CT and DA layers of this area was reclassified using different methods (natural breaks, equal interval, standard deviation and manual breaks) to show value comparison.
Full image.lab4_housing20112016 lab4dataclass
--Acquire Spatial and Tabular Census Data from University of Toronto census data site, then join the tabular data to spatial layers in order to visualizing housing data.
--A geodatabase was create to store and organize data.
--All layer from different sources were reprojected to UTM Zone 10N_NAD83 to represent this area.
--The CT and DA layers of this area was reclassified using different methods (natural breaks, equal interval, standard deviation and manual breaks) to show value comparison.