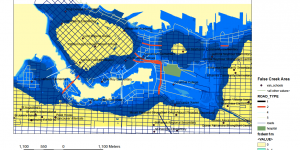
The DEM resolution of lab3_lowelevleg, lab3_flooding and lab3_roadsflood is 25,25, and the DEM resolution of lab3_falsecreek is 1,1. The lab3_lowelevleg and lab3_flooding highlight the area in low elevation which have higher potential to be influenced by the storm surge. The lab3_roadsflood highlights the major highways and expressways will be influenced by the flood. The lab3_falsecreek gives a detailed maps of schools and hospital that will be influenced by the storm in False Creek area. The data error may occur in data collection, because this series of maps is using data from different resources, while combining them together some error can be introduced to the maps.
- A geodatabase was create to store and organize data.
- All layer from different sources were reprojected to UTM Zone 10N_NAD83 to represent this area.
- The DEM layer of this area was reclassified based on elevation to indicate the area of flooding.
- Tabular data of school location was joined to spatial layer to highlight schools that will be affected by flooding.
- The shoreline of this area was buffered with 1 km and intersected with roads layer to describe the drowning sectionof major roads.
- Detailed area analysis was conducted on False Creek area with new site for St. Paul’s Hospital drawn on the map to show area affected by flooding.
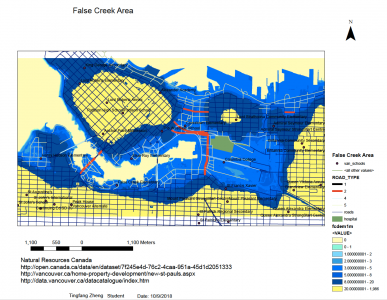
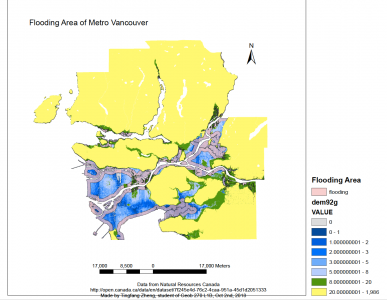
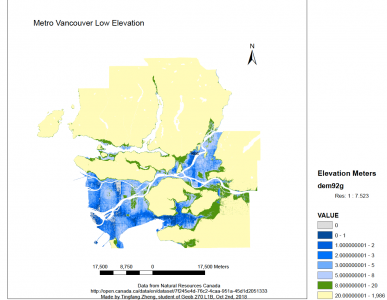
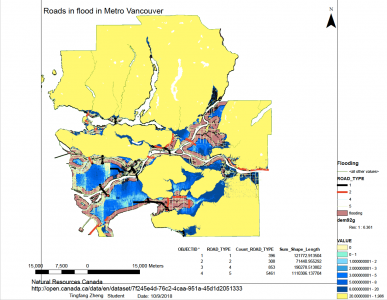
Full image.lab3_falsecreek lab3_roadsflood lab3_lowelevleg lab3_flooding
--A geodatabase was create to store and organize data.
--All layer from different sources were reprojected to UTM Zone 10N_NAD83 to represent this area.
--The DEM layer of this area was reclassified based on elevation to indicate the area of flooding.
--Tabular data of school location was joined to spatial layer to highlight schools that will be affected by flooding.
--The shoreline of this area was buffered with 1 km and intersected with roads layer to describe the drowning sectionof major roads.
--Detailed area analysis was conducted on False Creek area with new site for St. Paul’s Hospital drawn on the map to show area affected by flooding.